
Why do you need reports?
The only way to know if your online advertising is successful is to look at the data.
But with all the information available, things can quickly become a minefield of numbers and it can be difficult to find those key metrics.
Reports are a great way of seeing how things are going at-a-glance.
Why are reports time-consuming?
Reports help you view, organise and share large amounts of data with clients and colleagues. But if you have a lot of people to show data to, then your time can quickly disappear.
Also, copying data into spreadsheets is an easy way to introduce errors. These are then really difficult to find and fix, costing you even more time.
How do you make reporting easy?
The simplest way to avoid all these problems is to automate as much as possible. That’s where the free Adzooma software can help: build custom reports with information that’s pulled directly from your ad account, meaning it’s all accurate.
You can include bar charts, pie charts, line graphs, tables and much more to present data in the best way possible. Add any logo and save things ready for next time.
Not signed up to Adzooma yet?
With a full automation suite, 24/7 account monitoring, one-click improvements, intelligent reporting, and so much more, Adzooma is the smarter and easier way to manage your Google, Microsoft and Facebook ads.
Best of all? It’s completely free!
How to do it with Adzooma
Building custom reports with Adzooma couldn’t be easier. Let’s run through how to create one in a few quick steps. Then, once you’ve got one set up, you can re-run them over and over, saving hours of time.
Pre-made, ready-to-rock reports
At the top of the reports tab, you will find reports that are ready and waiting for you.
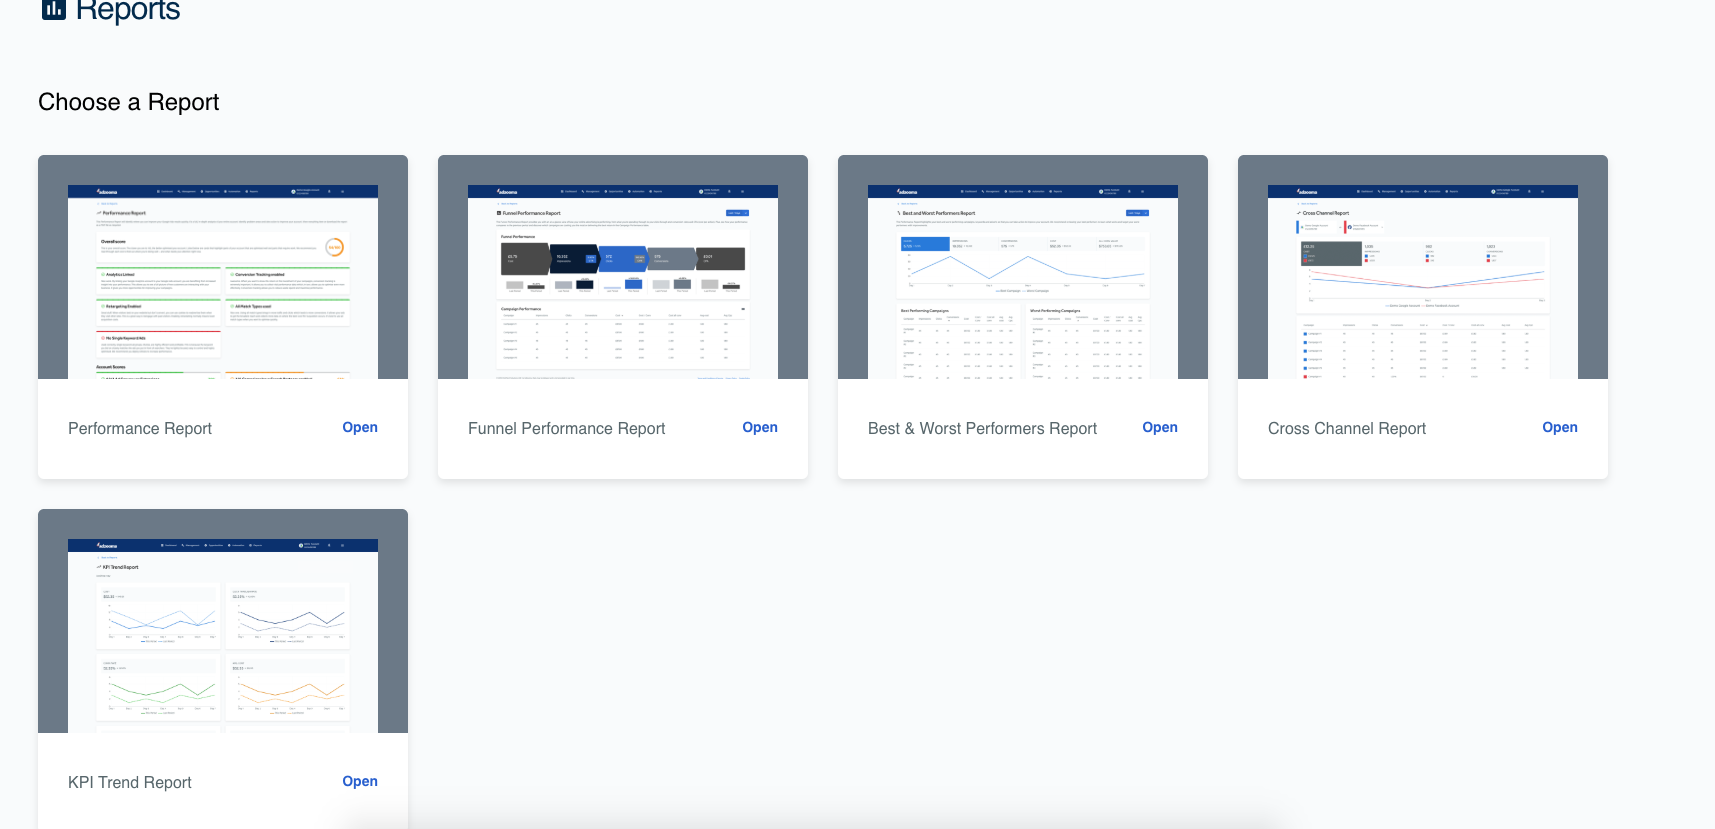
With just one click you can generate a:
Get a full analysis of your Google and Microsoft campaigns and discover exactly how well they are performing in under 60 seconds. Find out your score out of 100 and discover what changes you can immediately action to improve your profits and ROI.
The funnel performance report provides you with an at-a-glance view of how your online advertising is performing at every single level. It gives you insights on your total spend, impressions generated, click-through rates, conversion rates, and CPA (Cost Per Action).
Compare how each of these funnels compares to the previous period and accurately track your performance through time. What’s more, you’ll be able to see which campaigns are costing you the most or delivering the best returns.
Instantly identify your best and worst-performing campaigns, keywords and adverts with this report.
With your best performers, you’ll gain insights into what is working well for your business and resonating with your customers. On the other hand, your worst performers will highlight exactly which campaigns need your attention and improvements you can make to grow your overall success.
Compare the performance of your accounts across two different platforms, including Google, Microsoft and Facebook ads.
Showing key values such as spend, CPC (Cost Per Click) and conversion rate, you can see which platforms are working the best for your business and how to manage your budget to increase your ROI.
Measure your campaigns against your KPIs to track your progress and overall campaign performance.
Including key PPC report metrics such as spend, impression share, CTR, conversation rate, CPA (Cost Per Acquisition) and ROAS (Return On Ad Spend), this report will enable you to directly measure your success against your goals.
Creating a report
Step 1: Click the ‘New Report’ button in the top right.

Step 2: Click the grey pencil to edit the name of the report.

Step 3: Select from a variety of layouts by clicking on the layout button.
You can also add new pages with the button next to it.
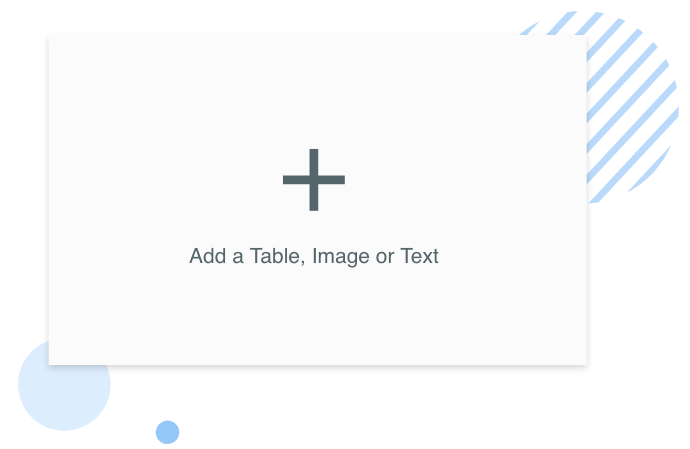
Step 4: Reports are made up of different widgets. Widgets include tables, charts, images and text so you can display the data you need in the best formats.
To add a widget, press the + sign.
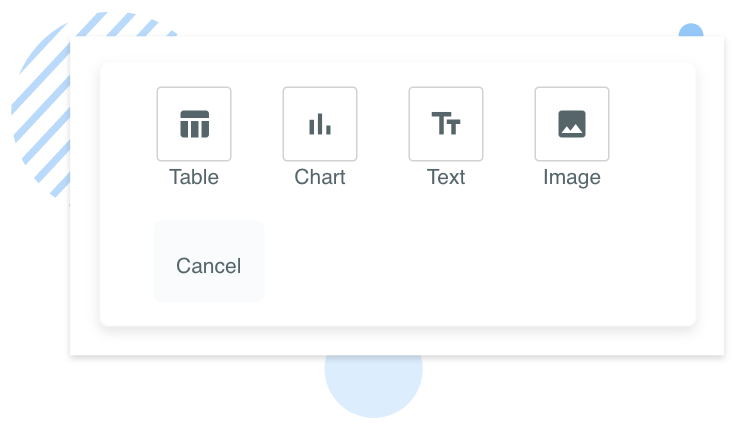
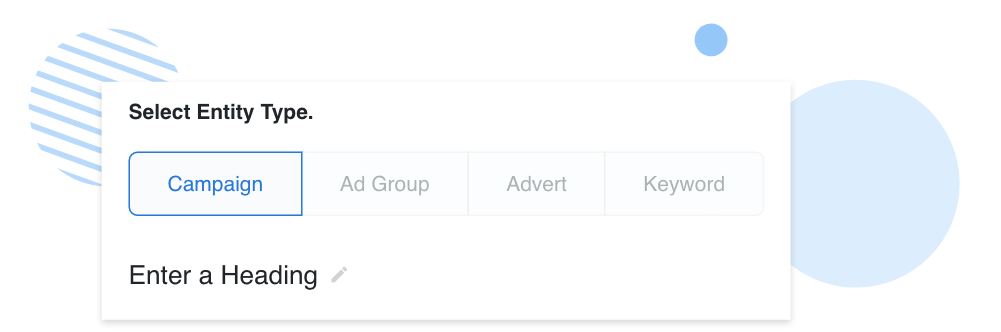
Step 5: Choose which element you want to add. Let’s say you wanted to add a table – you simply click table.
Step 6: Select which data you want to include in your table.
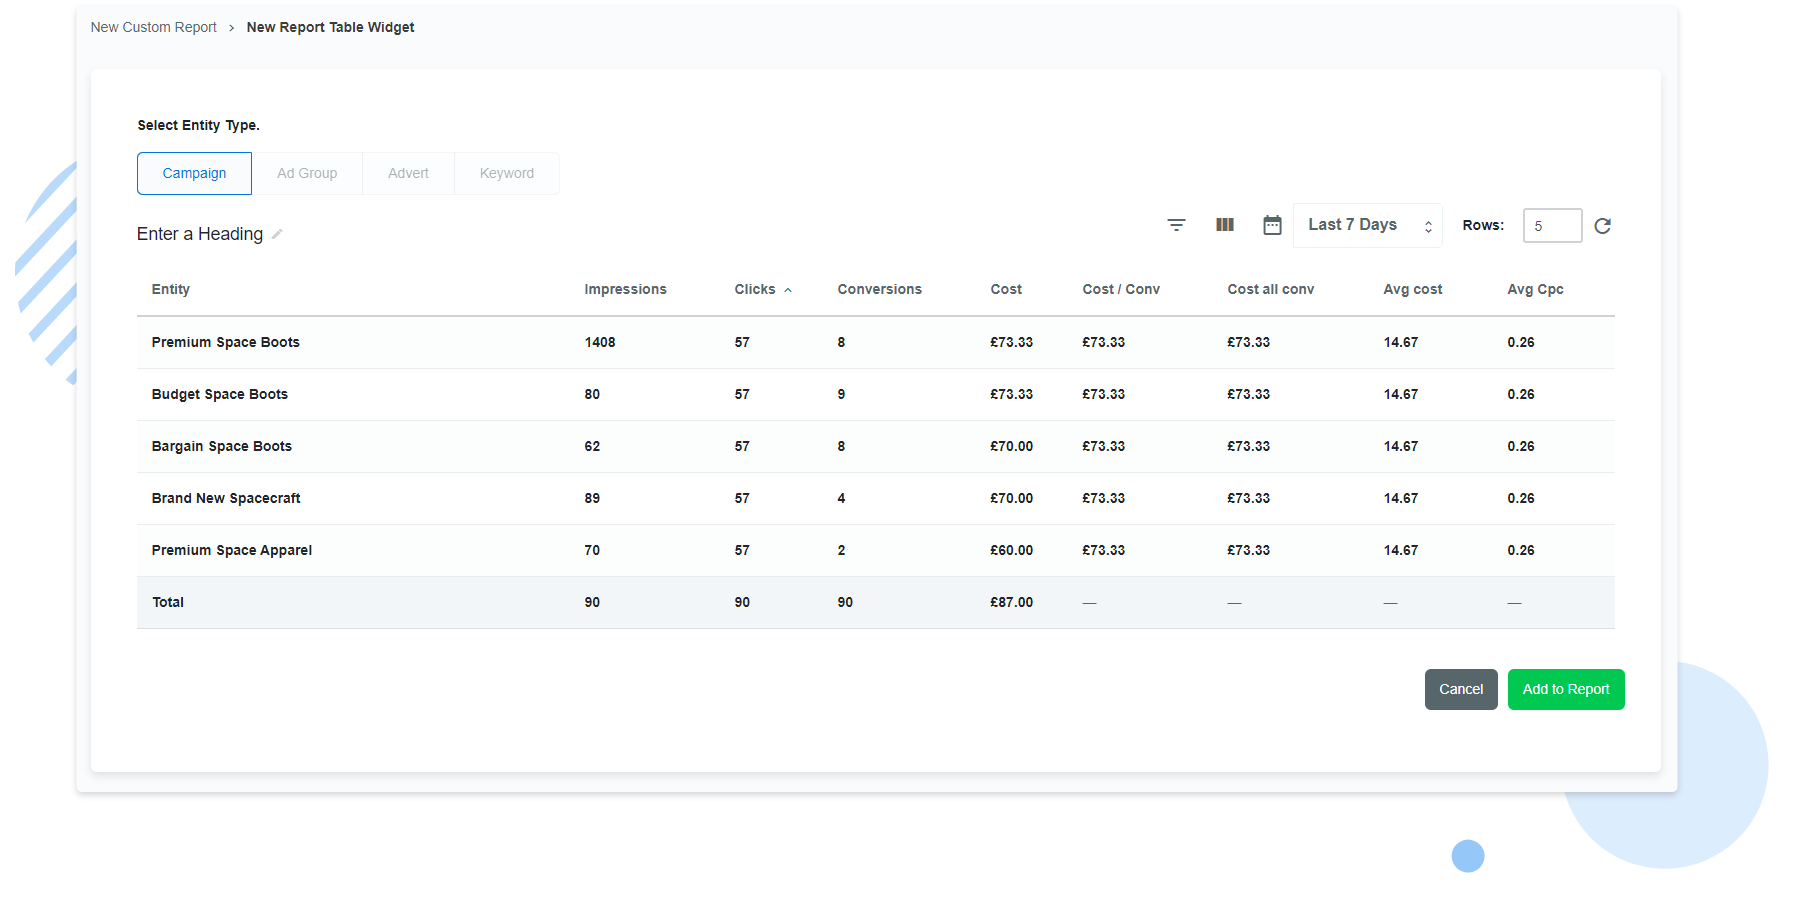
Step 7: Enter a heading at the top by clicking the pencil.
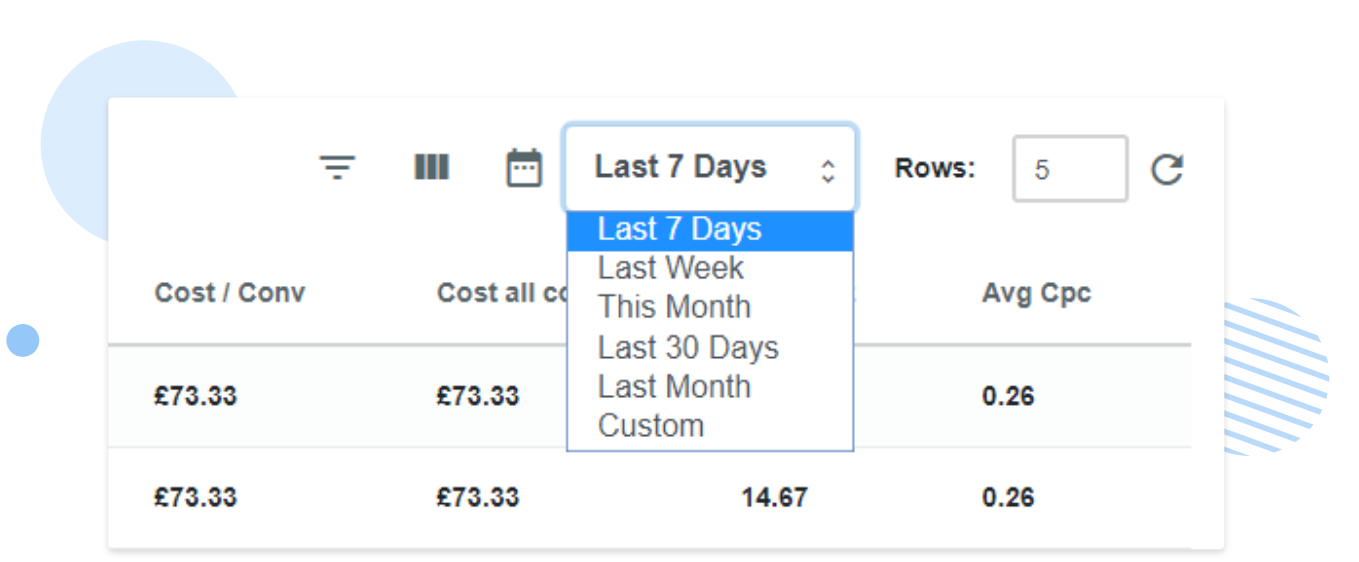
Step 8: Change the time frame at the top right.
Step 9: Once you’re happy, click add to report.
Step 10: You can repeat this for each type of widget available – charts, tables, text or images.
These images can be anything you want including logos to quickly brand the report.
Ready to get started?
The best part is that once you’ve saved the report, you can just go back in and re-run it whenever you need. This means whenever you need to update your colleagues or clients with the latest data, you’re just a few clicks away from having everything ready.
Create your first report in just a few minutes.
Reporting what’s important
A common problem with PPC reports is that they showcase the wrong things. Often vanity metrics are included: data which paints a rosier picture than is really true.
For instance, a report may show that a campaign has a high click-through rate. Great! But what does that actually mean for a business owner? Well, if there’s a high CTR but people are leaving the page as soon as they arrive, things aren’t actually going well. So there’s no reason to celebrate that data if it’s not the whole story.
You need to focus on the key metrics of the whole account and use the report to assess the overall performance of things. You can’t do that with skewed or incorrect data. So, make sure your reports are full of the right information.
By ditching the spreadsheets and using clear charts and tables to compare different aspects of each account, you can cut down the time spent creating and analysing reports.