This is a guest post from the Exclusive Concepts team. Here, EXCLUSIVE’s Paid Ads Strategists explain their one-of-a-kind free Google Ads scorecard and share how to interpret the results and drive performance and eliminate wasted ad spend.
Google Ads campaigns are instrumental to eCommerce success, but maximising the value of these campaigns requires accessing and understanding exactly what drives the results. Without that, it’s really just throwing money at keywords without fully understanding the ramifications of how that money is spent. And needless to say, a lot of that money gets wasted on non-performing or underperforming campaigns.
Making Sense of Google Ads Data
Unfortunately, it’s not always easy to discern how a campaign or ad is performing. The Google Ads interface is overstuffed with data requiring heavy filtering and downloading. Once you’ve exported your data, you have to aggregate it and dig deep in Excel to make sense of what’s there.
Once you’ve taken the time and used the skill required to do that, it can often be hard to tell what’s a true success. Just because a campaign is making money doesn’t mean it’s a true winner. And even if the RoAS (Return on Ad Spend) is the same on multiple products, that doesn’t mean that all of those products are equal when it comes to selling them efficiently and profitably.
Identify What Really Matters and What Really Performs
You need to be attuned to bigger-picture efficiencies and your personal business goals — those aren’t things found within Google Ads (like all ad platforms, Google Ads is a platform that exists to encourage you to always spend more even when it may not be truly worth it).
That’s why Exclusive Concepts created the Google Ads Scorecard. Time after time, executives and brand owners approached us with the same concerns about their Google Ads spending. It was clear to us that they were missing some key information and that we could assist them by providing that.
In this article, we’ll cover the key points our scorecard looks at so you can determine how your ads are performing.
Benefits of a Google Ads Scorecard: Executive-Level Advertising Insights
Our free scorecard covers products, keywords, devices, and branded versus non-branded performance. It ranks the best and worst performers in each category as well as the total cost of wasted spend so you can reduce that ASAP.
All of this information is presented in graphical reports that are clear and informative so that execs can make cost-saving, revenue-boosting decisions. It’s based on three months of historic data and pacing over the next 12 months so businesses can see the cumulative effects (and costs) of not optimizing. And once you run your scorecard, it automatically refreshes monthly so you can see your progress as well as new opportunities.
Data That Drives Results
A scorecard should be easy-to-read visual data presented clearly. You should see immediately where waste lies and where opportunities reside.
A good scorecard gives you more than just the raw data and displays, you should also get recommendations and insights that can only come from human advertising experts who bring a whole new dimension to the data.
In terms of specific breakdowns of performance, the Exclusive Concepts scorecard will show the following critical metrics. 1) Paid Search Score and Product
1) Paid Search Score and Product Ads Score

Based on your unique results, these scores show how close your overall Google ad health is to optimal. Color-coded and titled for info at a quick glance, these scores prepare you for the detail and breakdown of what’s to come later in the analysis. To start though, you’ll be able to easily identify where you are excelling and where you can improve.
2) Search Terms and Product Ad Spend Waste
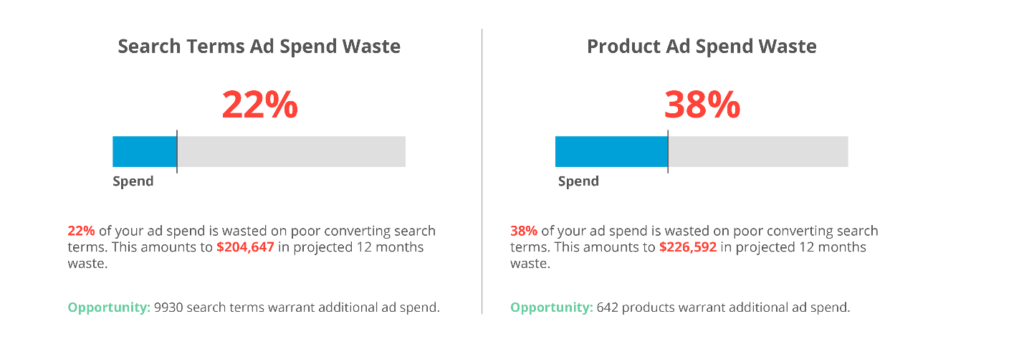
This section shows what percentage of spend is being wasted in each category. Wasted ad spend is any spend that isn’t hitting your RoAS goals or any spend on non-converting terms. We rank each brand’s best-to-worst performing keywords, so you can clearly identify areas of opportunity and areas that should be scaled back or reallotted.
This allows you to provide direction to your team and to hold them more accountable when it comes to meeting the goals you’ve set. You’ll see firsthand how you can stretch your spend by allocating more to winning campaigns and eliminating losing campaigns and redundancies that split impressions.
3) Paid Search Tablet Share

On average, mobile represents more than 50-60% of website traffic. By the same token, mobile can be one of the strongest drivers of poor return. Knowing your device placement performance will show if you’re making the most of this opportunity. Mobile-first eCommerce has never been more important, so this is a key area of improvement for most businesses.
Right now, the use of mobile devices is increasing — but so is the variety of mobile devices. You need to know what works for your unique brand and products. You need insight into how shoppers are viewing your ads, not just the search terms they used to get there. Shifting ad spend from one device type to another can be a real game-changer for some businesses. But you won’t know until you see firsthand the device types being used to engage with your adst.
4) Your Branded-Term Share

The intent in reviewing brand versus non-branded search term performance is to understand if the majority of your return is coming from existing customers. These shoppers know what they want and they ask for it by brand name. Branded terms will always outperform non-branded terms but they do little to bring you new acquisitions, so you need to find the right mix of branded and non-branded keywords.
Power Stat: Branded terms return at a 10X higher RoAS than non-brand terms. If you don’t own your branded terms, your competitors will and they’ll pocket all that RoAS and revenue that should be yours. Your scorecard will show you exactly where you stand on brand terms and if/where you can go further to seize those branded 10x RoAS terms.
Performance Metrics
Succinct and precise, this section provides a snapshot of your overall performance so you never lose sight of the big picture.
1) Search Term Performance (Detailed Breakdown)
10 Worst-Performing Search Terms
This result lists the 10 search terms that contribute the most waste to your ad spend. These keywords aren’t just failing to perform, they’re actually costing you not to perform. Once you know them, you can dial them back or even eliminate them and see immediate gains.
Rule of Thumb: Any search term waste over 10% needs improvement. Sometimes that improvement comes in the form of accepting that the search term just isn’t a winner. Don’t let gut feelings or instincts drive your decisions, look to the data in the scorecard.
10 Best-Performing Search Terms
Similarly, this list outlines the 10 best search terms in terms of ad performance. These are your winners, and once you’ve identified them, you can invest more heavily in them and try new strategies for incorporating them into growth campaigns.
2) Product Performance (Detailed Breakdown)
10 Worst and Best Performing Products
Using a products-based focus, these sections are comparable to the corresponding search term sections in that they list the exact products where you can reduce waste and increase your RoAS. These charts compare ad spend and revenue item by item to demonstrate why each product got the rating it did. Again, you’ve never seen your winners and losers identified so clearly, and once you have, you can make changes that get immediate results.
Rule of Thumb: Because product margins and performance factors vary so much between industries, there is no fixed benchmark when it comes to product ad waste. However, if you’re seeing product ad waste of 5-7%, you need to consider a new strategy for that product.
3) Campaign Performance (Detailed Breakdown)
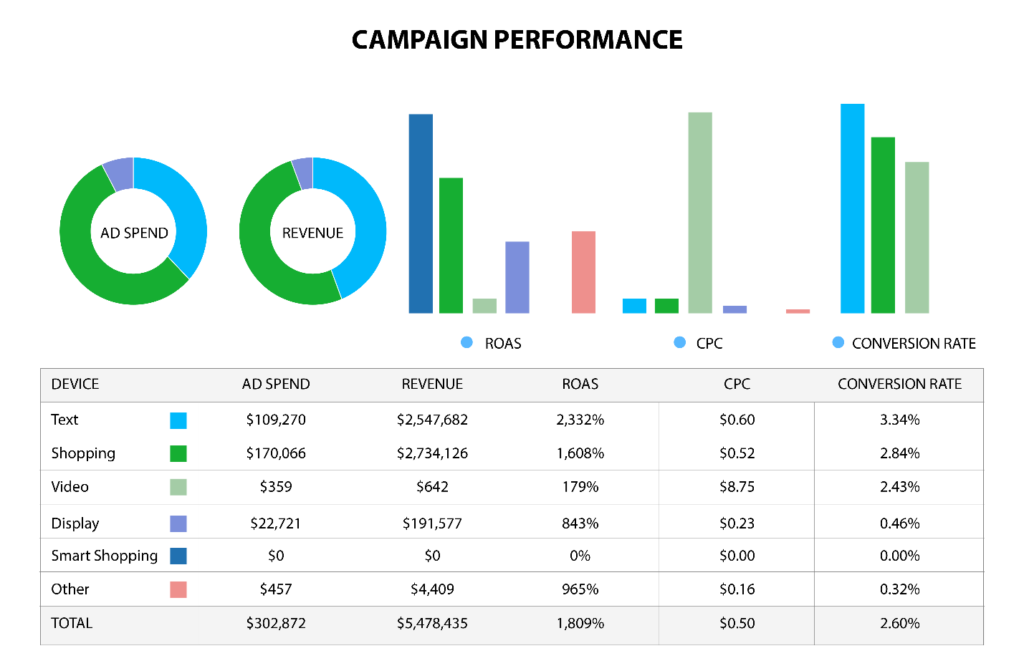
With metrics like ad spend, revenue, RoAS, cost per click (CPC), and conversion rate, this chart reviews performance for multi-channel campaigns. At a glance, you can see the results of your campaigns in text, shopping, video, display, smart shopping, and other vehicles.
4) Branded vs. Non-Branded Performance (Detailed Breakdown)
This shows strategic opportunities in branded vs. non-branded campaigns that many companies overlook. Running this report for your business will make sure you know you aren’t among those companies. This is low-hanging fruit. Shake that tree!
5) Paid Search Device Performance (Detailed Breakdown)
By comparing your device performance with ad spend, revenue, RoAS, CPC, and conversion rate, you can determine if and how your mobile, tablet, or desktop campaigns should be optimized. This section also includes best practices and examples of poor paid search campaigns to give you a point of comparison. Remember that when you provide shopping experiences optimized for a user’s device, you increase the likelihood of conversion.
6) Product Ads Device Performance
This section is designed to give you quick access to the essential information for the holistic performance of your product ads across devices. It will help you understand your audience and their shopping habits better so you can adjust your methods of reach.
Get Your Exclusive Google Ads Scorecard
Your Google Ads Scorecard delivers seriously powerful data and actionable insights. It shows you where you’re wasting money and where you could be making money. With Google Shopping being commission-free, you need every advertising advantage you can get in order to stand out from the competition. Request your free EXCLUSIVE Google Ads Scorecard today.