Tracking your website’s performance how it worked with your conversion funnel is vital. A fundamental bridge between the two is conversion rate optimisation (or CRO). But what is it and why is it something that should be monitored?
In this article, I will look at what CRO is and the best metrics to track and analyse your conversion rate.
What is conversion rate optimisation (CRO)?
Conversion rate optimisation is the process of increasing the number of site visitors who you want to take an action (which would result in a conversion). This can include:
- Signing up to a newsletter
- Creating an account
- Completing a form
- Downloading a white paper
- Making a purchase
Much like SEO, CRO is an optimisation process and requires constant improvements and maintenance. You need to understand the user experience (UX) of your website, the actions that visitors take, and what might be stopping them from converting.
Have you been using Google Analytics for your CRO?
Google Analytics is one of the most important CRO tools out there and if you’ve been using it, you will know how essential it is for CRO-related analytics. Insights from the platform can go a long way to helping you find areas for optimisation and split testing and with a basic knowledge of analytics, you can find great opportunities.
Top CRO analytics to track
But what do those opportunities look like? Here are 6 CRO analytics you can monitor and use in your optimisation efforts.
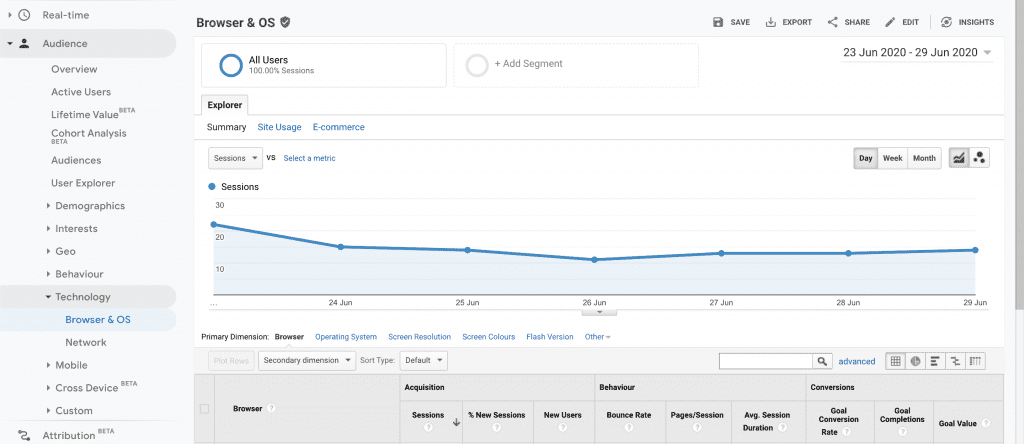
1. Conversions by Browser & OS
Not all browsers and operating systems are built the same; the experience on Windows 10 using Microsoft Edge is very different to someone using Safari on macOS Catalina, for example. That’s why the Technology reports in Google Analytics are a hotbed for CRO insights.
In the Browser & OS report you can find the following data categories (which you can set as Dimensions):
- Browser
- Operating System
- Screen Resolution
- Screen Colors
- Flash Version
- Java Support
Why this is important: When it comes to browsers, are there any that convert lower than the rest of them on your site? If you find that is the case, then you can click on that specific browser to see the different versions. Then you will be able to see if there are some versions that are particularly hindering the conversion rate.
How to track in Google Analytics: You can produce a report for this by going to the Audience > Technology > Browser & OS. Set your date range and look to the third set of columns under the heading, Conversions.
Note: Make sure you’ve set up conversion goals!
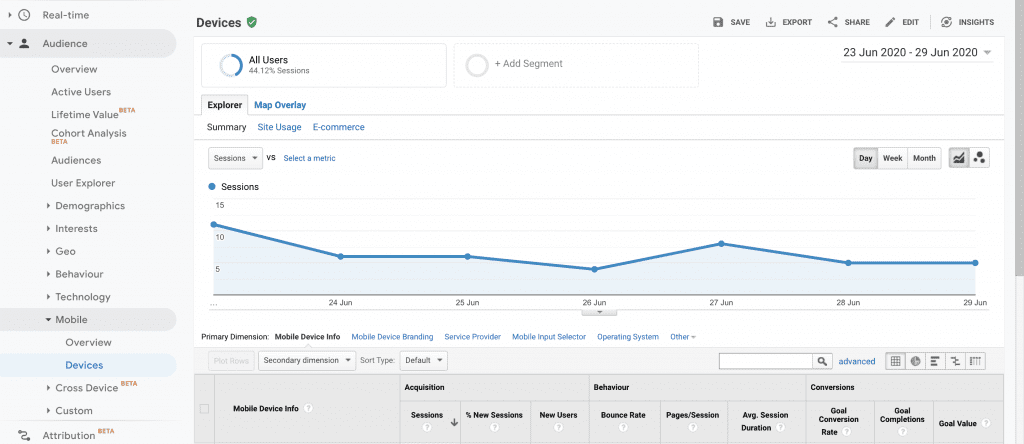
2. Mobile conversions
You might find that there is a particular mobile device that represents a large percentage of your website traffic. But if there is a bug in that mobile system, then it means that you’re losing a big opportunity. It could also be worth seeing if there are any differences between smartphones and tablets, and compare to desktop. If you find that there are some discrepancies, then you know where to look next.
Why this is important: The most common mobile devices you’re likely to find are iPhones, Samsung Galaxy’s, and Pixel phones. But only optimising for these is alienating a large pool of potential customers. 72.6% of smartphones worldwide use Android compared to 26.72% using iOS (as of May 2020). As there are millions of different Android devices around the world, you need to take them into consideration. You can’t optimise for all of them of course but completely ignoring them isn’t advisable either.
How to track in Google Analytics: You can produce a report for this by going to the Audience > Technology > Mobile > Devices. This gives you a list of known mobile devices that have been used to access your site. Set your date range as normal and check the Conversions section against other metrics.
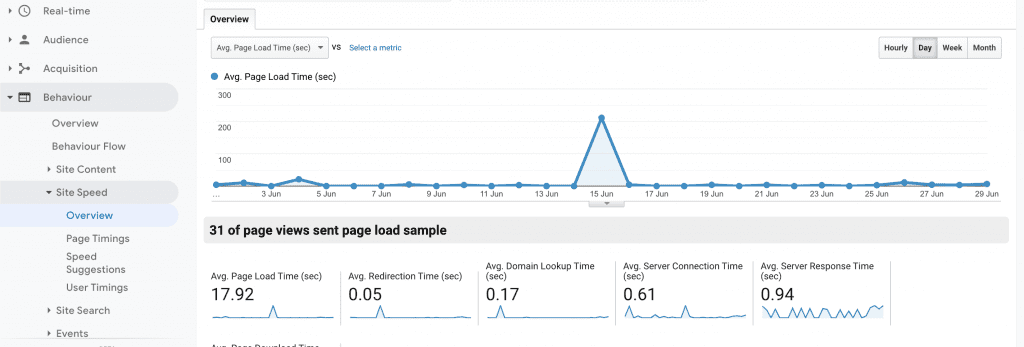
3. Site speed
There will be a much better user experience if you have a site that loads quickly. The longer people stay on your site the more likely they’ll convert. The general rule is to aim for 3 seconds or less to avoid the risk of visitors becoming bouncers.
If you are interested in the user experience, then you need to care about the speed of your site. Check if there are any browsers that have slow load times, and then you can go from there.
Why this is important: Site speed is not only a UX necessity but it’s also a ranking factor (according to the mercurial John Mueller). It’s also linked to revenue—a 2017 study by Akamai showed that “a 100-millisecond delay in website load time could hurt conversion rates by 7%”. A slow site costs you money in the long run.
How to track in Google Analytics: You can produce a report for this by going to the Behaviour > Site Speed. From there, you can check an overview of your site speed data, analyse Page Timings, Speed Suggestions, and User Timings.
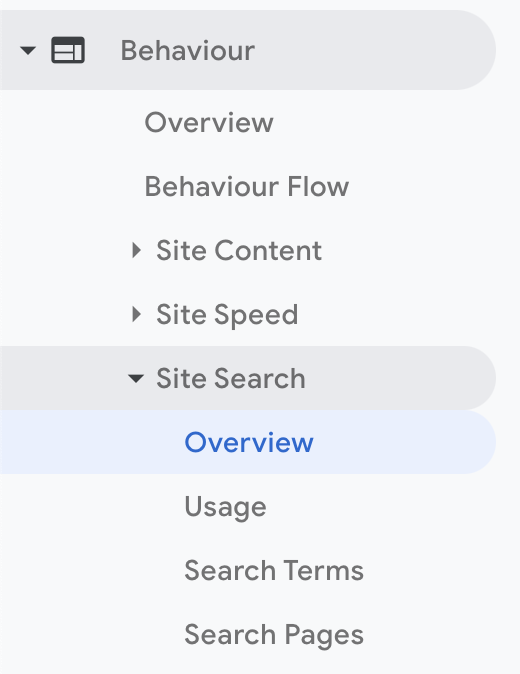
4. Site Search
Site search is an underrated tool for CRO. It cuts out the middle man of navigating through a site to find something. It’s either there or it isn’t and that’s down to the efficacy of your copy, internal linking, and general site architecture. Using data analysis, you can see behavioural aspects of your site searchers compared to the visitors that don’t search, and then use that to your advantage.
Why this is important: According to a study by Screen Pages, visitors who used internal site search contributed to 13.8% of the revenues generated. It can also give you content ideas. If you have an e-commerce site and someone searches for something that generates a 404 page (meaning there wasn’t a page the matched their search), you might need to create that page and meet the demand.
How to track in Google Analytics: This can be found by navigating to Behaviour > Site Search. From there, you can get an overview, analyse Usage, Search Terms and Search Pages.
5. Traffic by Hour of the Day
People search at different times. The assumption is traffic is highest after 5pm on a weekday in your local area but that’s not the case for all sites. Viewing your site data by time can give you quite a variety of insights. This can be about what site visitors are buying at certain times and what they are searching for at certain times. Not only that, but you can also compare it to marketing campaigns, and the times and days that offers and promotions went out.
Why this is important: When is the best time to release a special offer to customers to generate the most revenue and gain the most traffic? It’s not going to be same for all sites and the only way to know is with an analytics report. You also need the data to plan for potential server overloads. If everyone accesses your site at the same time, it will cause slower speeds for other customers, lose money, traffic, and potential repeat custom.
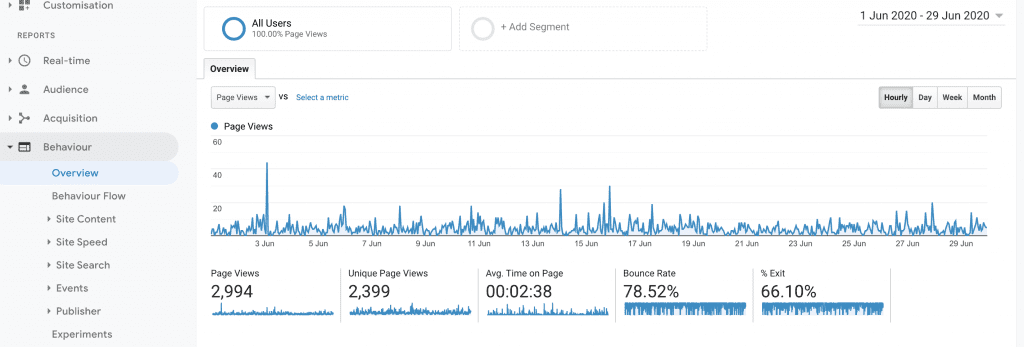
How to track in Google Analytics: To find site traffic, navigate to Acquisition > All Traffic. From there, you can check the Channels tab, Tree Maps, Source/Medium, and Referrals. For each one, you can analyse your data by Day, Week, and Month. But for hourly data, you can find this under Behaviour > Overview.
6. Behaviour funnel
If your site has a lot of content, then you need to think about what the content does to help, or possibly hinder, conversion. You might find that some content brings in more conversions than others, whereas others that get a lot of traffic don’t convert. Then you can see what pages of content have the biggest business value.
Why this is important: To build the best funnel, you need to know how site visitors behave and navigate your site. A funnel analysis, for example, can show the exit rates on landing pages and if they’re particularly high, a place for necessary optimisation.
How to track in Google Analytics: You can set up Funnel Visualisation in Google Analytics by going to Conversions > Funnel Visualisation. Then you need to set up your goals. You can also analyse your Multi-Channel Funnels from the same section to see how your marketing strategy is working together to create conversions.
Conclusion
Using web analytics is essential for CRO.
But it’s also important to remember what CRO entails. It requires user data research to draw logical conclusions and form better lead gen strategies. The combination of Google Analytics can give insights into your target market, user behaviour and the potential to improve your site structure if necessary.
And never forget to set your goals and keep in mind the CUTE model:
- Clarity – make your site clear to understand for all users
- Urgency – site visitors want results immediately—it’s your job to give them that to the best of your ability
- Trust – offer users security and trust when they use your product or service
- Evidence – before you make a change to your site, ensure you have social proof that this is necessary
Keep it CUTE and let CRO lead the way to more sales and conversion.