
Google Analytics is a powerful tool for analyzing the results of website promotion. It allows you to get comprehensive information. However, the standard features are not the only elements available to users. Using R, for example, allows you to receive, process and analyze large amounts of unique data. In this article, we’ll look at one example: lost revenue.
What is R?
R is one of the popular programming languages at the moment. It is free and is widely used by specialists because, being a software environment, it opens up great possibilities for statistical calculations, powerful data extraction, and analysis.
Combining the R programming language and Google Analytics is a great opportunity to improve your business. This allows for in-depth statistical analysis and the resulting data can be visualized meaning you gain a better understanding of your own business and opportunities for improvement.
For effective promotion, it is important to work on the quality of the content as the presence of mistakes in the text can cost a loss of consumer confidence. To avoid typos, use services like Grammarly, ProWritingAid, Essaywriter and others. This will help in creating a positive image and improve business performance.
What do you need to apply the algorithm?
Here are 7 things you will need in order to make this work:
- A site with necessary Google Analytics tracking codes.
- An account for Google services.
- R programming language (download).
- The RStudio programming environment.
- Packages for Google services (available on GitHub).
- Developer Client (created in Google Developer Console).
- A Google Ads token.
How to create a Developer Client in Google Developer Console
- Go to Google Developer Console.
- In the dropdown menu (top left) find Product & Services.
- Next, select the API manager.
- You will see a list of APIs. We are interested in the Analytics API. It must be found and activated.
- In the menu on the left, find the Credentials item. Next – OAuth client ID.
- Fill in the Name field, then create permissions.
- You will be presented with credentials (i.e. Client Secret as well as Client ID). We will use them later.
Run the script in RStudio
You can proceed to this stage only after the previous steps have been completed. This is a prerequisite. After completing them, you have to connect the packages that you need to work.
To do this, start RStudio, find the “Source” area and paste the following script fragment into it:
install.packages(curl)
require(curl)
install.packages(bitops)
require(bitops)
install.packages(devtools)
require(devtools)
install.packages(RGoogleAnalytics)
require(RGoogleAnalytics)
install_github('jburkhardt/RAdwords')
require(RAdwords)
These packages are needed to install work packages, as well as interact with the relevant services (Google Analytics, Google Ads).
The script must be run in parts. First, select the first part and press Ctrl+Enter.
Setting variables
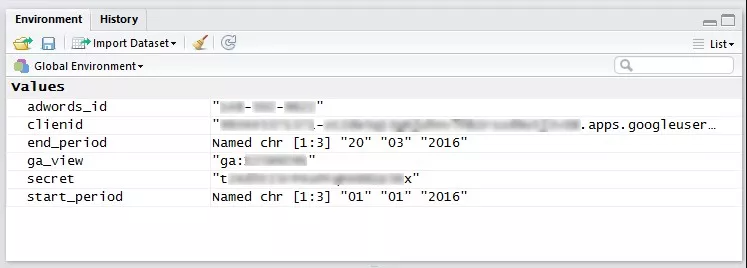
For the subsequent work, many variables are needed. Therefore, we will set them.
clienid <- 150487456763-XXXXXXXXXXXXXXX.apps.googleusercontent.com
secret <- TUXXXXXXXXXXXX_TknUI
ga_view <- ga:XXXXXXXX
adwords_id <- XXX-XXX-XXXX
Variables need to contain personalized information. Namely:
- clienid is the client ID contained in the developer console.
- secret is Client Secret from there.
- ga_view is the ID of the view from the Google Analytics service. Are not sure how to find it? Go to the Administrator section. Next, select View → Settings. There you will find the View ID. Don’t rewrite it. Better to copy and directly add to the script. It will look like: ga: xxxxxxxxx.
- adwords_id is the client’s ID directly in the corresponding service.
We set the period for which the lost income will be determined:
start_period <- c(day = 01,
	month = 01,
	year = 2016)

end_period  <- c(day = 20,
	month = 03,
	year = 2016)
Set the days and months you are interested in. Next, select a part of the script with the mouse. Run. You can determine the success of the actions by the appearance of all the above variables in RStudio.
Next, we will authorize in the services.
Google Analytics
- Open RGoogleAnalytics package → find “Auth” command → paste ga_auth <- Auth (clienid, secret) → run.
- You will be prompted to save your authorization credentials. It is worth giving up. After that, you will receive a generated link that you need to insert into the browser line.
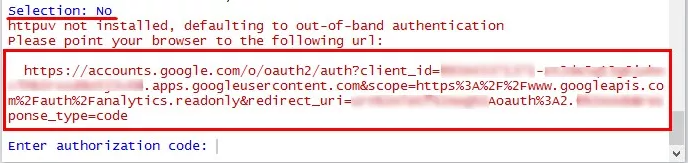
- Select the required account from the list of accounts that appears. That is, associated with a service.
- Let’s view the data.
- You will receive an access key. Copy it. Next, insert the resulting key into RStudio.
Google Ads
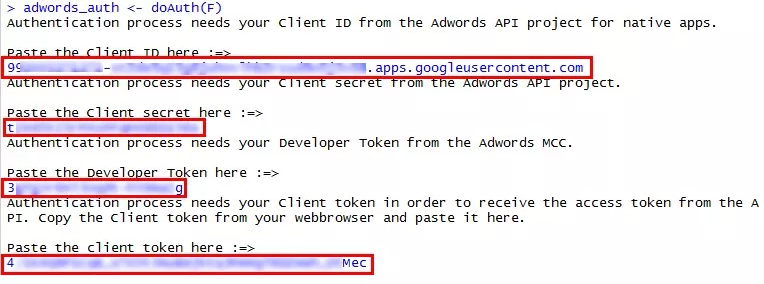
- Open RStudio. Run the “doAuth” command by running the script: adwords_auth <- doAuth (F). You will need to specify the client ID, as well as the Secret. We got them at the very beginning, when we created the Developer Client. You also need an Ads API token. Enter it. Must have at least basic access level.
- Select an account from the list. Let’s view the data. After that, a key will be generated, which must be inserted into RStudio.
Authentication complete.
It remains to add the last fragment of the script. It will start querying the data, collecting table information, and performing calculations. We will describe the script itself below.
Google Analytics request
query.list <- Init(start.date = paste(start_period[year],start_period[month],
  start_period[day],sep = -),
  end.date = paste(end_period[year],end_period[month],end_period[day],sep = -),
  dimensions = ga:adwordsCampaignID, ga:campaign,
  metrics = ga:transactions,ga:transactionRevenue,
  filters = ga:medium==cpc, ga:source==google,
  table.id = ga_view)
Creating an API object for the request
ga.query <- QueryBuilder(query.list)Getting data from Google Analytics
gaData <- GetReportData(ga.query, ga_auth,
  split_daywise = FALSE, paginate_query = FALSE)
API request to Google Ads
body <- statement(select=c('CampaignId',
	'Impressions',
  	'Clicks',
  	'Cost',
  	'Ctr',
  	'SearchBudgetLostImpressionShare',
	'SearchRankLostImpressionShare   ',
	'ContentBudgetLostImpressionShare',
	'ContentRankLostImpressionShare'),
	report=CAMPAIGN_PERFORMANCE_REPORT,
	start=paste0(start_period[year],start_period[month],start_period[day]),
	end=paste0(end_period[year],end_period[month],end_period[day]))
Request to Google Ads
adwordsData <- getData(clientCustomerId = adwords_id,
 	google_auth = adwords_auth,
 	statement = body,
 	transformation = T,
 	apiVersion = 201605)
Connecting data from services
totalData <- merge(gaData, adwordsData,
  by.x = adwordsCampaignID, by.y = CampaignID, all.x = TRUE)
Replacing missing values with zeros
for (i in 1:length(totalData)){
	totalData[which(is.na(totalData[i])),i] <- 0
}
Script that will calculate lost transactions
totalData$lostImpressionByBudgetSearc <- round(totalData$Impressions / (1-totalData$SearchLostIS_budget) - totalData$Impressions,0)

totalData$lostImpressionByRankSearc <- round(totalData$Impressions / (1-totalData$SearchLostIS_rank) - totalData$Impressions,0)

totalData$lostImpressionByBudgetDisplay <- round(totalData$Impressions / (1-totalData$ContentLostIS_budget) - totalData$Impressions,0)

totalData$lostImpressionByRankDisplay <- round(totalData$Impressions / (1-totalData$ContentLostIS_rank) - totalData$Impressions,0)

totalData$lostImpressionByBudge <- totalData$lostImpressionByBudgetSearch + totalData$lostImpressionByBudgetDisplay

totalData$lostImpressionByRan <- totalData$lostImpressionByRankSearc + totalData$lostImpressionByRankDisplay

totalData$lostClicksByBudge <- round(totalData$lostImpressionByBudget * (totalData$CTR),0)

totalData$lostClicksByRan <- round(totalData$lostImpressionByRank * (totalData$CTR),0)

totalData$lostTransactionsByBudge <- ifelse(is.nan(round(totalData$lostClicksByBudget * (totalData$transactions / totalData$Clicks),0)),0,round(totalData$lostClicksByBudget * (totalData$transactions / totalData$Clicks),0))

totalData$lostTransactionsByRan <- ifelse(is.nan(round(totalData$lostClicksByRank * (totalData$transactions / totalData$Clicks),0)),0,round(totalData$lostClicksByRank * (totalData$transactions / totalData$Clicks),0))

totalData$lostTransaction <- totalData$lostTransactionsByBudget + totalData$lostTransactionsByRank

totalData$lostRevenueByBudget <- ifelse(is.nan(round(totalData$lostTransactionsByBudget * (totalData$transactionRevenue / totalData$transactions),0)), 0,round(totalData$lostTransactionsByBudget * (totalData$transactionRevenue / totalData$transactions),0))

totalData$lostRevenueByRank <- ifelse(is.nan(round(totalData$lostTransactionsByRank * (totalData$transactionRevenue / totalData$transactions),0)), 0, round(totalData$lostTransactionsByRank * (totalData$transactionRevenue / totalData$transactions),0))

totalData$lostRevenue <- ifelse(is.nan(totalData$lostRevenueByBudget + totalData$lostRevenueByRank),0,totalData$lostRevenueByBudget + totalData$lostRevenueByRank)
Uploading results (csv)
write.table(totalData, file='lostRevenue.csv', sep = ;, dec = ,, row.names = FALSE)Visualizing Results in a Circle Chart
lost_revenue <- c('received income' = sum(totalData$transactionRevenue), 'lost on budget' = sum(totalData$lostRevenueByBudget), 'lost by rating' = sum(totalData$lostRevenueByRank))

pie(lost_revenue,col = c(green, red, firebrick))
Visualising the data
R provides rich rendering capabilities. However, mastering them takes time. The easiest and fastest way is to build with the “ggplot2” package.
- Installation and connection of the package:
install.packages(ggplot2)
require(ggplot2)- Building a data frame, which will be the basis for building a histogram:
HistData <- rbind(data.frame(subset(totalData, select = c(Campaign, transactionRevenue)), Type = GottenRevenue),
setNames(data.frame(subset(totalData, select = c(Campaign, lostRevenueByBudget)), Type = LostByBudget), c(Campaign, transactionRevenue,Type)),
setNames(data.frame(subset(totalData, select = c(Campaign, lostRevenueByRank)), Type = LostByRank), c(Campaign, transactionRevenue,Type)))
HistData <- HistData[!is.nan(HistData$transactionRevenue),]- Plotting a column chart:
ggplot(HistData, aes(x = Campaign, y = transactionRevenue, fill = Type))+
geom_bar(stat = identity, position = fill)+
scale_fill_manual(values=c(forestgreen, firebrick1, tan1))+
theme(axis.text.x = element_text(angle = 90, hjust = 1, size = 7))+
ggtitle(Lost Conversion rate)
Conclusion
Information is one of the most valuable things. By receiving and analyzing data, you will learn more about your business. This means you can improve your activities and we hope the above instructions will help with this. You don’t need to be a programmer to use advanced features—just a little time and diligence is enough.